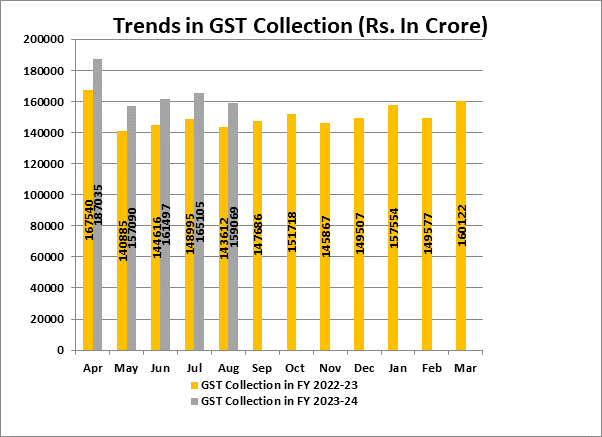
The gross GST revenue collected in the month of August, 2023 is ₹1,59,069 crore, which is 11% higher than the GST revenue collected in the same month last year. The revenue from import of goods was 3% higher and the revenues from domestic transactions (including import of services) are 14% higher than the revenues from these sources during the same month last year.
The total GST income collected in August 2023 was ₹1,59,069, of which CGST was 28.328 billion, SGST was 35.794 billion, IGST was 83.251 billion (including 43.550 billion in revenue from the import of goods), and Cess was 11.695 billion (including 1.01 billion in revenue from the import of goods).
The government has paid 31,408 crores in SGST from IGST and 37,581 crores to CGST. After routine settlement, the total income for the CGST and SGST for the month of August 2023 is 65,909 crore for the Centre and 67,202 crore for the States.
The details of the GST revenue collected in August 2023 are as follows:
- CGST: ₹28,328 crore
- SGST: ₹35,794 crore
- IGST: ₹83,251 crore (including ₹43,550 crore collected on import of goods)
- Cess: ₹11,695 crore (including ₹1,016 crore collected on import of goods)
The total revenue of Centre and the States in the month of August, 2023 after regular settlement is ₹65,909 crore for CGST and ₹67,202 crore for the SGST.
The August 2023 revenues are 11% greater than the GST revenues from the same month in the previous year. In comparison to the same month last year, the income from imports of products was up 3% and the revenue from domestic transactions, which includes the import of services, was up 14%.
The graph below illustrates the yearly trends in monthly gross GST receipts. Table 1 compares the state-by-state amounts of GST collected in each State in August 2023 to August 2022, and Table 2 lists the amounts of SGST and the SGST component of the IGST received by the States and UTs in August 2023.
Table-1: State-wise Y-o-Y growth of GST Revenue in August, 2023[1] (Rs. In crore)
|
State/UT |
August’22 |
August’23 |
Growth(%) |
|
Jammu and Kashmir |
434 |
523 |
21 |
|
Himachal Pradesh |
709 |
725 |
2 |
|
Punjab |
1651 |
1813 |
10 |
|
Chandigarh |
179 |
192 |
7 |
|
Uttarakhand |
1094 |
1353 |
24 |
|
Haryana |
6772 |
7666 |
13 |
|
Delhi |
4349 |
4620 |
6 |
|
Rajasthan |
3341 |
3626 |
9 |
|
Uttar Pradesh |
6781 |
7468 |
10 |
|
Bihar |
1271 |
1379 |
9 |
|
Sikkim |
247 |
320 |
29 |
|
Arunachal Pradesh |
59 |
82 |
39 |
|
Nagaland |
38 |
51 |
37 |
|
Manipur |
35 |
40 |
17 |
|
Mizoram |
28 |
32 |
13 |
|
Tripura |
56 |
78 |
40 |
|
Meghalaya |
147 |
189 |
28 |
|
Assam |
1055 |
1148 |
9 |
|
West Bengal |
4600 |
4800 |
4 |
|
Jharkhand |
2595 |
2721 |
5 |
|
Odisha |
3884 |
4408 |
14 |
|
Chhattisgarh |
2442 |
2896 |
19 |
|
Madhya Pradesh |
2814 |
3064 |
9 |
|
Gujarat |
8684 |
9765 |
12 |
|
Daman and Diu and Dadra and Nagar Haveli |
311
|
324
|
4
|
|
Maharashtra |
18863 |
23282 |
23 |
|
Karnataka |
9583 |
11116 |
16 |
|
Goa |
376 |
509 |
36 |
|
Lakshadweep |
0 |
3 |
853 |
|
Kerala |
2036 |
2306 |
13 |
|
Tamil Nadu |
8386 |
9475 |
13 |
|
Puducherry |
200 |
231 |
15 |
|
Andaman and Nicobar Islands |
16 |
21 |
35 |
|
Telangana |
3871 |
4393 |
13 |
|
Andhra Pradesh |
3173 |
3479 |
10 |
|
Ladakh |
19 |
27 |
39 |
|
Other Territory |
224 |
184 |
(18) |
|
Center Jurisdiction |
205 |
193 |
(6) |
|
Grand Total |
100526 |
114503 |
14 |
Table-2: Amount of SGST & SGST portion of IGST settled to States/UTs in August, 2023 (Rs. In crore)
|
State/UT |
SGST collection |
SGST portion of IGST |
Total |
|
Jammu and Kashmir |
220 |
420 |
640 |
|
Himachal Pradesh |
182 |
210 |
392 |
|
Punjab |
603 |
1,201 |
1,804 |
|
Chandigarh |
51 |
119 |
171 |
|
Uttarakhand |
382 |
255 |
637 |
|
Haryana |
1,585 |
1,094 |
2,679 |
|
Delhi |
1,113 |
1,209 |
2,322 |
|
Rajasthan |
1,265 |
1,730 |
2,994 |
|
Uttar Pradesh |
2,378 |
3,165 |
5,544 |
|
Bihar |
654 |
1,336 |
1,990 |
|
Sikkim |
42 |
43 |
85 |
|
Arunachal Pradesh |
40 |
100 |
140 |
|
Nagaland |
23 |
59 |
82 |
|
Manipur |
21 |
62 |
83 |
|
Mizoram |
17 |
54 |
72 |
|
Tripura |
36 |
84 |
120 |
|
Meghalaya |
50 |
86 |
136 |
|
Assam |
440 |
691 |
1,131 |
|
West Bengal |
1,797 |
1,516 |
3,313 |
|
Jharkhand |
802 |
120 |
922 |
|
Odisha |
1,333 |
401 |
1,734 |
|
Chhattisgarh |
710 |
488 |
1,198 |
|
Madhya Pradesh |
978 |
1,447 |
2,425 |
|
Gujarat |
3,211 |
1,723 |
4,933 |
|
Dadra and Nagar Haveli and Daman and Diu |
51 |
40 |
90 |
|
Maharashtra |
7,630 |
3,841 |
11,470 |
|
Karnataka |
3,029 |
2,627 |
5,656 |
|
Goa |
174 |
111 |
285 |
|
Lakshadweep |
0 |
2 |
2 |
|
Kerala |
1,035 |
1,437 |
2,472 |
|
Tamil Nadu |
3,301 |
2,212 |
5,513 |
|
Puducherry |
43 |
51 |
94 |
|
Andaman and Nicobar Islands |
10 |
22 |
33 |
|
Telangana |
1,439 |
1,746 |
3,186 |
|
Andhra Pradesh |
1,122 |
1,481 |
2,603 |
|
Ladakh |
14 |
43 |
57 |
|
Other Territory |
13 |
182 |
195 |
|
Grand Total |
35,794 |
31,408 |
67,202 |

